 RSS Feed
 Twitter
 Facebook
 Email
Email Home
HomeCharting the Dow
Posted by Larry Doyle on May 20th, 2010 2:44 PM |
While financial media and the financial industry tend to focus on the day to day, I believe we are far better served to look at the big picture and chart the major market averages over a longer time frame. To that end, what does a 3 year chart of the Dow tell us? Let’s navigate.
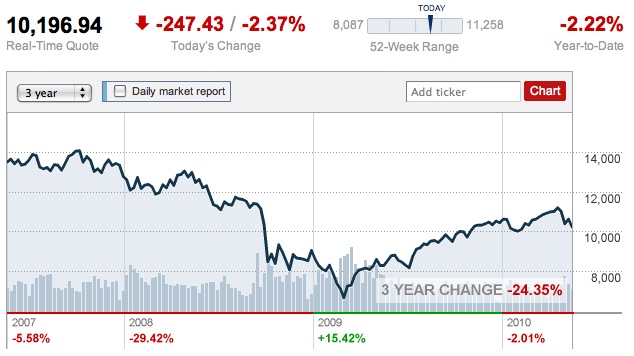
The Dow topped out at slightly over the 14000 level in the 4th quarter of 2007. We bottomed at approximately 6600 in March 2009. The Dow moved to a recent high of approximately 11,300 and is now trading at 10,200.
What do these numbers represent? (more…)


